Next: Simulation Requirements Verification Up: Analysis of Sample Transportation Previous: Analysis of Sample Transportation Contents
Before the simulation environment can become fully operational, we need to verify that the underlying behaviors and conservation principles are strictly adhered to. For example, if a passenger declares the need to travel from locations A to B, we should verify that no matter what, the passenger will eventually arrive. Similarly, the number of passengers waiting at a station at any time needs to be consistent with flows of passengers arriving/leaving the station.
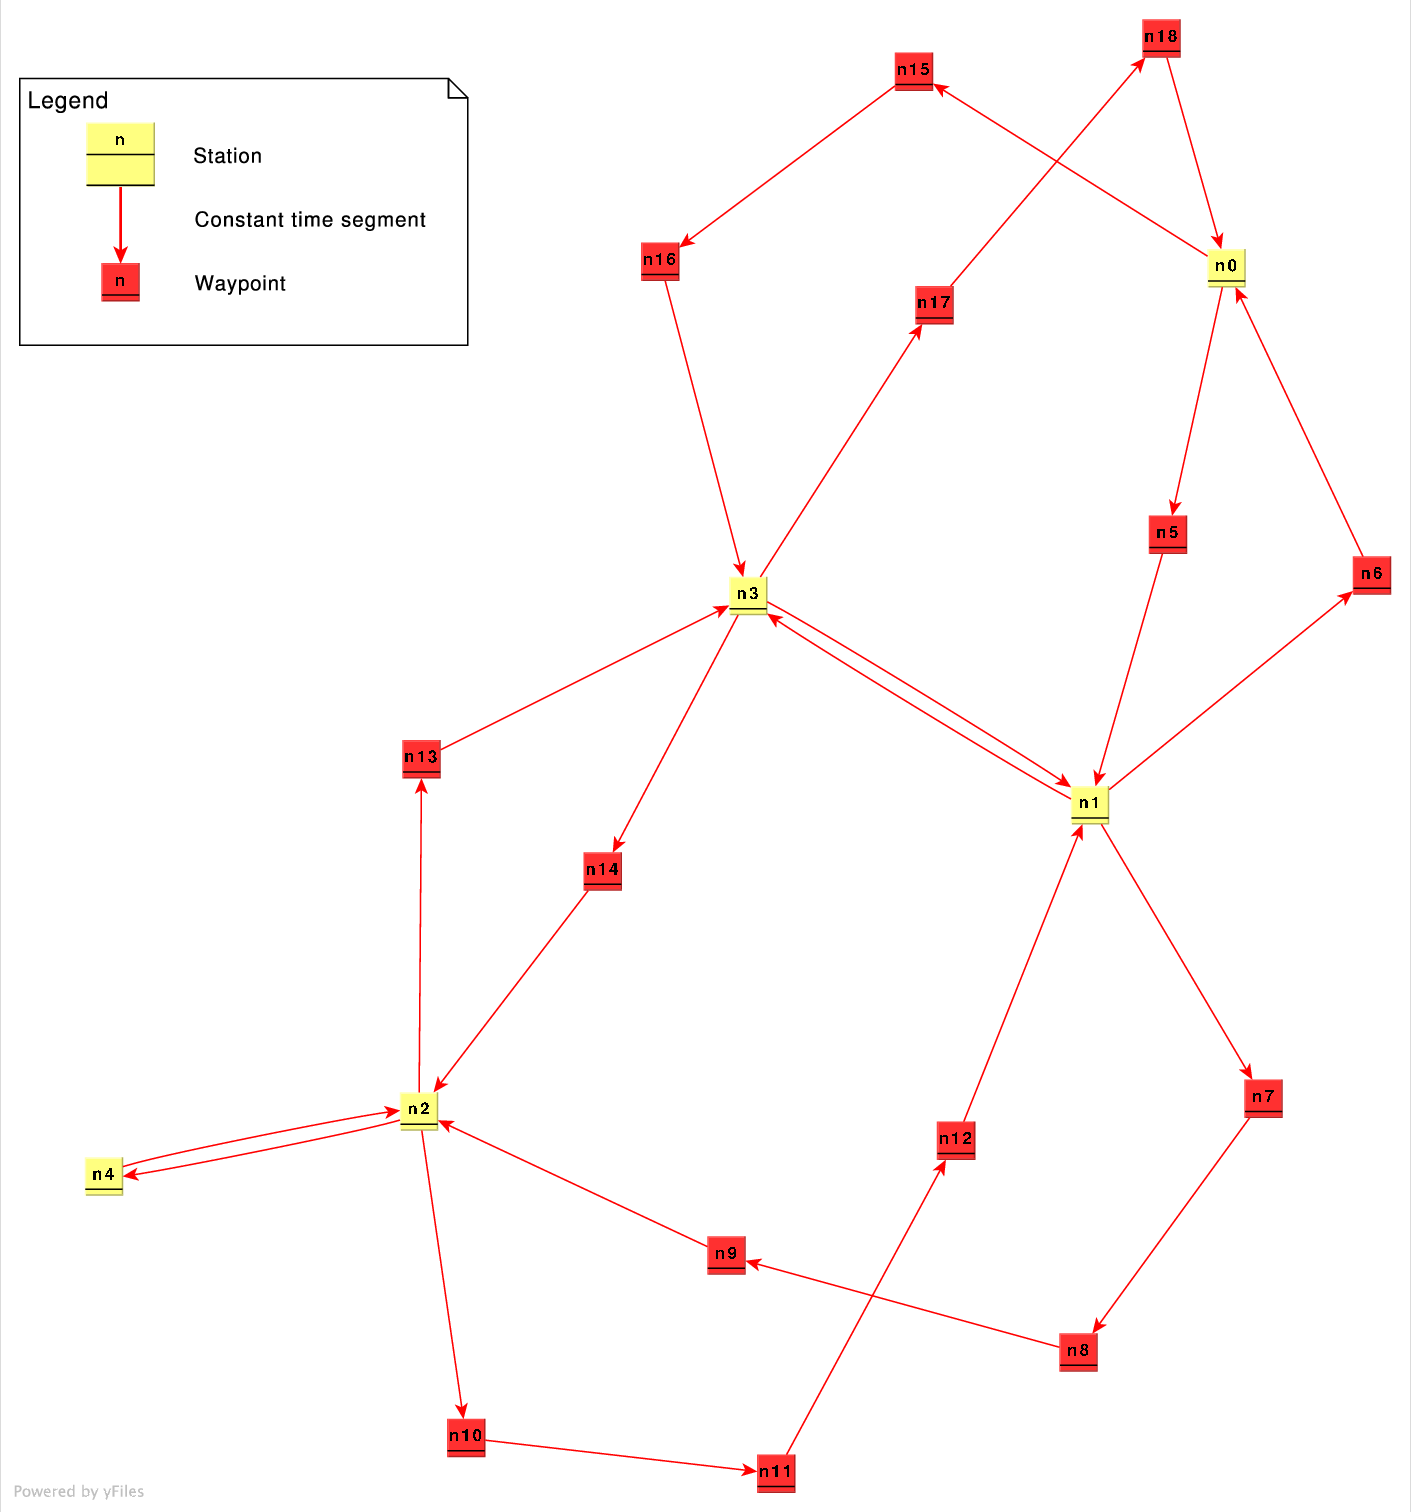
Several arbitrary transit networks such as the one shown in Figure 5.1 provides a variety of test cases for different combinations of connections between stations and waypoints used in system verification and validation. The graph demonstrates the functionality of both bidirectional station-station links, and different combinations of unidirectional station links connected via one or more waypoints. Additionally it provides multiple equal length routes linking several stations (such as n1-n2 and n0-n3) to encourage use of alternate pathways during congestion. Several simulation runs with different demands and initial conditions provided test feedback during development.
 |
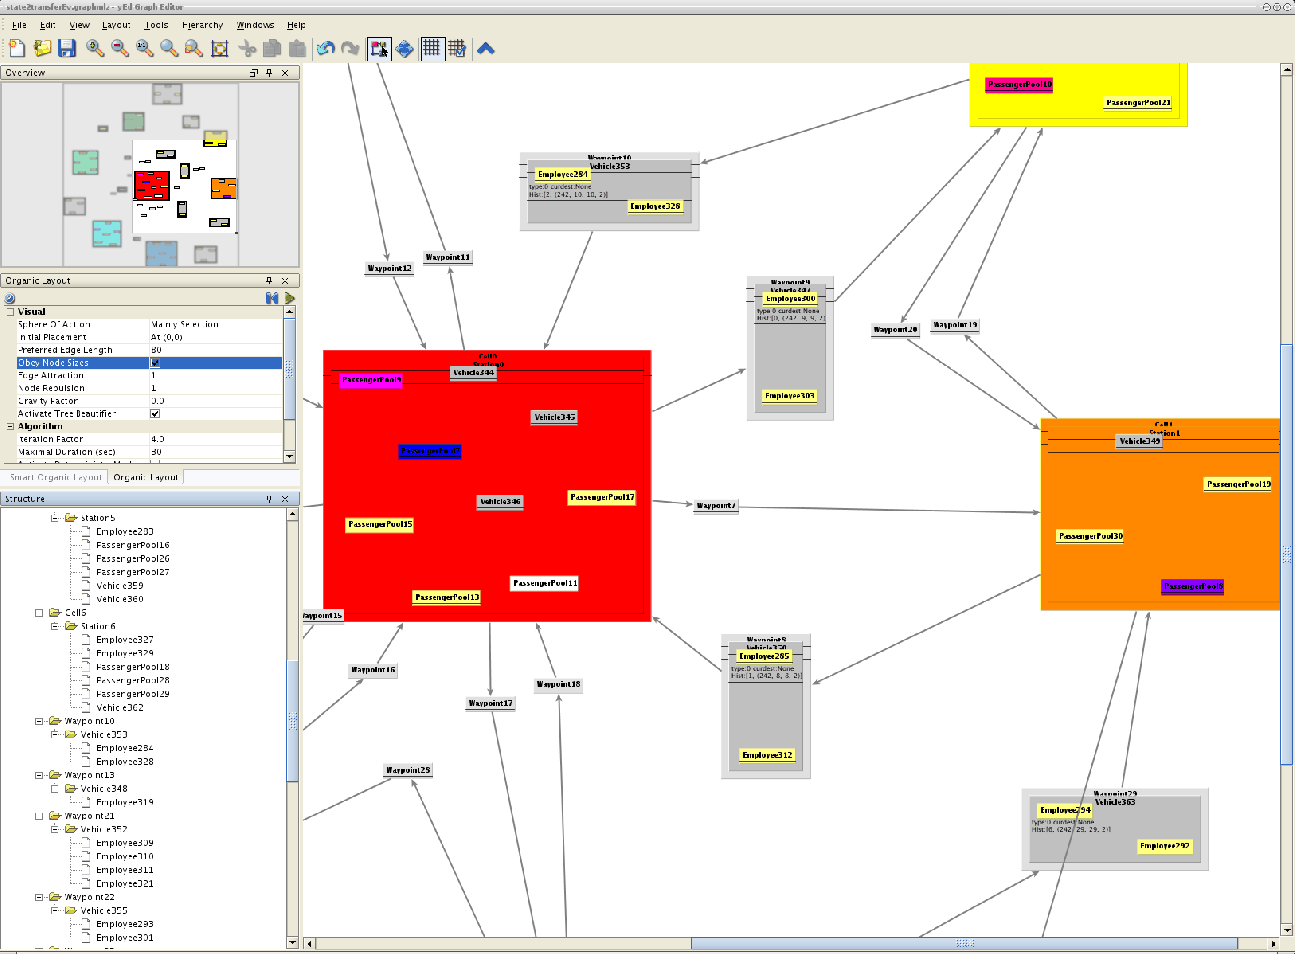
The simulation leaves periodic dumps of the system state in graphML format that we can load into the yEd graph layout tool to visually inspect the object tree. These snapshots show us the locations of individual vehicles and passengers, along with records of their transit history. The entities are represented as nested UML objects, color coded by station. A portion of one of these zoomable diagrams is shown in Figure 5.2.
We could also attempt to model a regular 2D grid network. By applying several simplifications to allow our prototype fleet scheduler to scale up to a 25-node 2D triangular grid, we could model a PRT-like network. We simplified the model by restricting it to single passenger (or small party) vehicles, which eliminates transfers. The simulation will still unload and reload passengers as they traverse station nodes, but we can safely assume the passengers simply stay in the same vehicle they arrived on.
![\includegraphics[width=0.8\columnwidth]{figures/tg0_PRT.eps}](mainthesis-img38.png)
|
Rowin Andruscavage 2007-05-22