 System
Description
System
DescriptionArcology Systems Simulation
Rowin Andruscavage
http://hairball.bumba.net/~rwa2/school/ense799/Arcology.html
University of Maryland
ENSE799 Fall 2005
Dr. Mark Austin
An arcology is a combination of architecture with ecology, essentially forming an environmentally friendly human living system well suited to systems engineering analysis. This document defines and describes a network queuing simulation model that might be used to perform trade study analysis on such a system. The model attempts to structurally decompose the human habitat into groups of subsystems on all scale levels that interact through the exchange of resource groups. The resulting resource flows are quantified into performance metrics used to compare different types of arcologies to current living conditions. Bottom-up scenarios of arcology models will be compared to top-down scenarios constructed based on present day statistical data. Tradeoff studies focus on feasibility of coverage based on differing transportation network topologies. Finally, this document outlines a verification and validation plan for models created using the simulation engine.
Arcology Systems 1
Abstract: 1
Table of Contents 2
System Description 4
System Model 6
Concept Requirements 6
Goals 6
Objectives 8
Use Case Diagrams 8
System Structure 11
GeneralClasses Object Model Diagram 12
Cell 12
LeafCell 13
CellHierarchy 13
Environment 17
TransportationInfrastructure 18
Transportation 18
Reactions 20
Resources 22
System Behavior 25
Events: 25
Individual 26
ResourceEngine 28
ReactionEngine 29
InputResources 31
OutputResources 32
Combustion 32
Refining 34
System Requirements Allocation 34
Requirements 34
Arcology Primitive Requirements 35
Arcology Derived Requirements 35
Simulation Requirements 35
Requirements Traceability 36
Primary Energy Consumption by Fuel 36
Specifications 37
Specs for Arcology Primitive Requirements 37
Specs for Arcology Derived Requirements 38
Specs for Simulation 38
Tradeoff Analysis 38
Design / Decision Variables 39
System Wide Measures of Effectiveness 39
Transportation System Preliminary Design Input Parameters 40
Transportation System Measures of Effectiveness for Tradeoff Analysis 40
Optimization Problem Formulation 41
Pareto Optimal Solution Space 41
Verification Test Plans 43
Simulation Requirements Verification 44
Simulation Specification Verification 49
Validation Evaluation Plans 49
Macro Level Validation Scenarios 50
Micro Level Validation Scenarios 51
Bibliography & References 51
Appendix 52
Schedgen.pl Source Listing 52
Example Mixed Integer Programming Model 61
 System
Description
System
DescriptionThe concept of the arcology was first introduced in the 1950s by architect Paolo Soleri as the ultimate urban planning solution to the problems of metropolitan growth. Continuing trends in the expansion of metropolitan areas have contributed to explosive growth of low density suburban sprawl, the decay of inner city urban areas, and finally the indiscriminate destruction of natural environments to make room for a human habitat system which is increasingly less efficient, convenient, and aesthetic. The concept of the arcology attempts to reverse those trends by providing a compact city infrastructure that works.
What is an arcology? Featured in several science fiction works as the city of the future, an arcology is more than just a structure... a "superbuilding" that contains everything you would expect to see in a current city. The arcology integrates living spaces and working spaces with transportation systems that connect it all. One of the fundamental differences is that it heavily involves the third dimension into city planning, whereas current planning is done by zoning commercial / residential / industrial in an ad hoc fashion (well, by government committee through series of votes, demonstrations, bribes, and legal means applied in a reactive manner which fulfills actual requirements just as well as ad hoc design process). Naturally, the arcology is simply what a city would be if it was to be designed by competent systems engineers (of course, a feat easier said than done).
Another advantage to designing cities from the perspective of an arcology is that it forces you to take all scale levels into account in the design. This allows the arcology to transition better as new technologies are put into place.
On the national level, arcologies would be constructed to connect well to other arcologies, with effective transportation and distribution systems. Current cities have transportation problems. Many cities grew around ports. However, shipping is no longer the primary means for distributing goods. The United States has invested heavily in the highway system. However, around many cities these get tied up in rush hour congestion, resulting in delays and waste. Airports are usually built too far from the city to connect well to mass transit systems, or have been enveloped (and throttled) by the city and create a nuisance to nearby residents.
On the personal level, much infrastructure for living does not have flexibility for change. We are still using much of the same infrastructure developed over a century ago for power and telephone. Additional systems have sprouted up on top of these networks, such as cable television and various wireless networks that compete for spectrum, and a myriad of PBX, fiber optics, etc. for corporations. Various combinations of water mains, sewage systems, natural gas pipelines. A modular arcology structure would need to be able to adapt to support new networks.
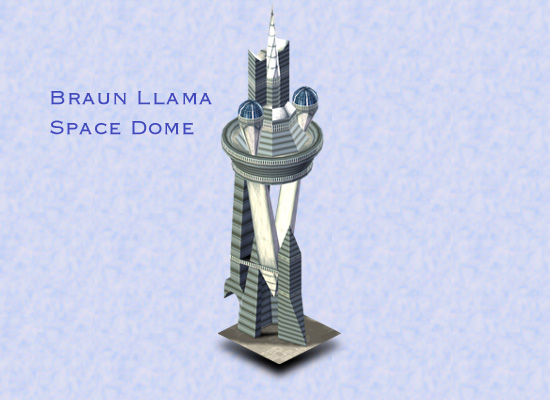
The purpose of an arcology is to create a compact, organized structure for people to live and work. It should be designed to improve and maximize upon the quality of life of its residents, while also performing well economically, in production, and in development. The transportation system is one of the keys to making the system perform. This connective tissue accounts for how well most of the rest of the system can perform.
Paolo Soleri describes several arcology designs that could be used to replace major cities or serve well in several environmental settings. This project would create a tool that could be used to quantitatively analyze the benefits of replacing cities with arcologies. This report describes the systems engineering of a tool to perform systems engineering preliminary design & benefits analysis.
 Previous
well-known works that tackle this task includes two open-ended games
from Maxis (now part of Electronic Arts) that approach the problem
from two different scales: SimCity and The Sims.
Beyond that, there is not much published in the way of city and
lifestyle simulation. This is probably partly because most of this
analysis can be done more simply using historical data tracked by
government statistical agencies, and because most of the simulation
writers are more busy simulating more interesting things such as data
and transportation networks. Not many people are in a position to
design cities, however, almost everyone needs to work within the
infrastructure of one, so it would be worthwhile to create a model if
only to serve as a dynamic demand generator used to plug input
parameters into these data and transportation networks. Surely they
can use historical data as inputs, but this breaks down when a system
they are designing may have a significant effect on the input data.
One item of study that this type of simulation makes feasible is the relationship between these data networks and transportation networks. For example, if a city decides to spend money upgrading their data infrastructure so more people might be able to telecommute to work, this may have a noticeable impact on the load on their mass transit system. This simulation could aid as a decision-making support tool that could actually tie the network and transportation models together.
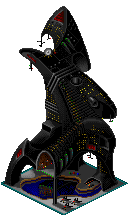
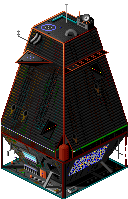
Insets: Concept art of arcologies in SimCity 3000
Below: Arcologies from SimCity 2000


The approach for this project involved using Ilogix Rhapsody® in C++ Development Edition to construct UML diagrams of the system. Work proceeds under the expectation that the code generation facilities of Rhapsody could be used to embed C++ source code in the framework to compile and run a working executable as part of the Systems Modeling and Analysis course in the future. As an added benefit, Rhapsody also provides documentation generation of the model in rich text format. This project documentation is interspersed into this report with appropriate commentary and then exported to html.
One of the side effects of using Rhapsody include some subtle differences in naming conventions, presumably used to simplify the merging of the standard OMG UML specification with the practical realities of software engineering frameworks. Notably, Rhapsody uses "Object Model Diagrams" in place of both "Class Diagrams" and "Instance Diagrams". Since this project deals with abstract models, we will almost always be referring to class diagrams except when dealing with actual scenarios.
One of the characteristics of systems such as cities that grew by evolution rather than by design is that they lack fundamental policies that drive their design. Components of the city usually come about in a reactionary manner: fire protection services are built after too many buildings burn down, airports are built to serve cities after they have already grown too dense to accommodate one in a central location, tap water distribution systems are gutted out and replaced only after the old ones were too heavily loaded to be sanitary.
Hindsight being 20/20, it is worthwhile to dwell on past mistakes and develop urban planning with a systems engineering process worthy of supporting a megalopolis. The first step is to develop a set of goals and objectives that drive the design of the city. At first glance, the goal of a city (at least as envisioned in SimCity) ought to be to grow and prosper. However, this overlooks the city’s primary responsibility to fulfill the needs and look after the well being of its inhabitants. For that, we can look at it from an individual level on par with the scale of The Sims:
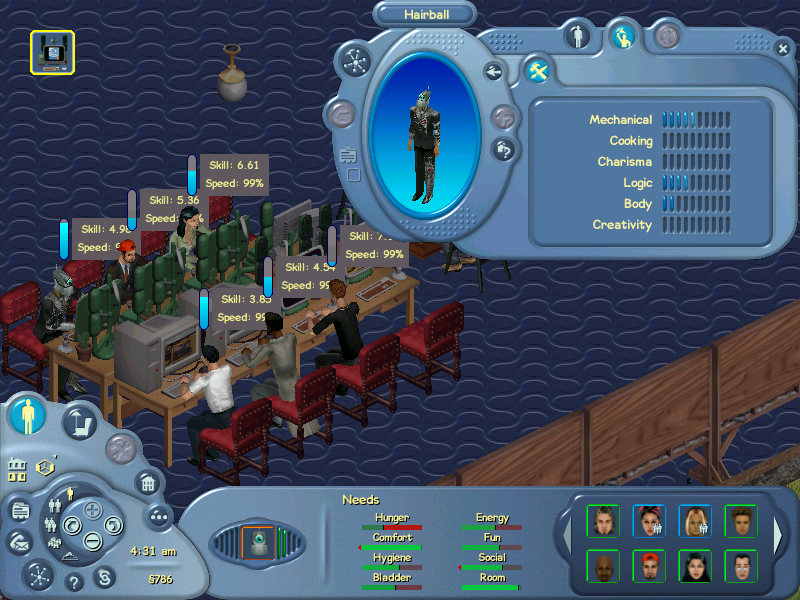
Figure 1: The Sims Entity Requirements Model
The Sims offers 8 needs for each of their simulated characters: Hunger, Energy, Comfort, Fun, Hygiene, Social, Bladder, and Room
This model takes an even simpler approach:
Shelter – where people live and sleep (accounts for Energy, Comfort, and Room)
Food / Air / Water – the raw materials people need to consume to live, or at least not starve to death (accounts for Hunger)
Health – maintenance factors, such as cleanliness, waste, (accounts for Hygiene and Bladder)
Work – most people need something productive to do when they aren’t attending to their other needs. This could take the form of working for money, or being educated to increase their knowledge bank of information.
Entertainment – if people aren’t doing something productive, they’re probably doing something fun to while away their time (accounts for Fun and Social)
In order to fulfill these needs for all of the city’s inhabitants efficiently, what they are really looking at is developing infrastructure to move resources around so that each of these needs can be catered to. This simulation model takes on abstract views of these resources and the transportation networks that move them around.
So what should our objectives be, if we are to meet our goals, how can we form an objective function for optimization? Of course, we’re talking about multivariate optimization of multiple goals.
Continually improve the quality of life for inhabitants
Accelerate development of improvements to the body of knowledge
Maximize productivity, performance.
Optimize resource consumption to achieve balance with the environment.
Avoid optimizing the whole at the expense of the few by trampling individual freedoms. Add structure to the system by providing opportunities and alternatives, not imposing restrictions.
In order for the simulation model to be effective, it should be capable of assigning metrics corresponding to these objectives, and computing them based on the simulation inputs. The simulation inputs and execution will have to sufficiently model real life enough to be able to produce a valid estimate of these performance metrics.
As described, the arcology use cases are simple enough, and represent a few different modes of operation. The system boundary is provided by the living quarters, which, contrary to its name, extends beyond the individual's residence and just encompasses all the locations where they go about their business. The arcology simulation model will need to be flexible enough to model these types of activities in order to be used for design.
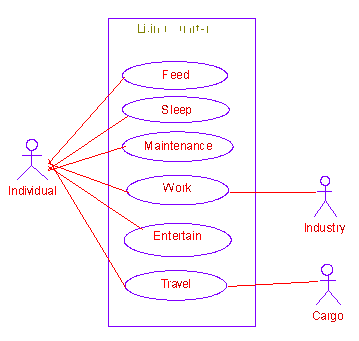
Figure 2: Live Use Case Diagram
The one new activity introduced by this diagram is the Travel interaction. As mentioned, not all of these use cases occur in one location, so the Travel case takes care of moving the individual from one location to another. This interaction is performed through one of the Cargo Transportation Infrastructure classes, which will be detailed in the System Structure.
Relations:
itsFeed
Association with Feed, Multiplicity of 1, Bi-directional
itsSleep
Association with Sleep, Multiplicity of 1, Bi-directional
itsMaintenance
Association with Maintenance, Multiplicity of 1, Bi-directional
itsWork
Association with Work, Multiplicity of 1, Bi-directional
itsEntertain
Association with Entertain, Multiplicity of 1, Bi-directional
itsTravel
Association with Travel, Multiplicity of 1, Bi-directional
Relations:
itsWork
Association with Work, Multiplicity of 1, Bi-directional
Transportation Infrastructure responsible for moving people around (as well as resources).
Relations:
itsTravel
Association with Travel, Multiplicity of 1, Bi-directional
Everyone needs a place to rest for a significant portion of the daily cycle.
Relations:
itsIndividual
Consumption of food and water resources.
Relations:
itsIndividual
Miscellaneous cleaning tasks, such as bathing, brushing teeth, doing laundry, dishes, etc. would be represented here.
Relations:
itsIndividual
Work is a transaction between and individual and an industry to exchange money for productivity. In this case, productivity fuels the reactions that the industry performs.
Relations:
itsIndividual
itsIndustry
Entertainment can take on several forms, from merely socializing with other individuals, engaging in solitary entertainment interactions (TV, games), to mass entertainment (theatre, etc.).
Extension points:
Social
Relations:
itsIndividual
An individual is able to travel through the transportation infrastructure to commute to work or to travel to places to fulfill their other needs, such as for food or social interaction with friends.
Relations:
itsIndividual
itsCargo
Use cases for the simulation model:
Set up a modeling scenario using input data.
Build bottom-up scenario: Since the arcology is designed from the ground-up, starting at the individual level, the structure of our model would allows us to calculate the aggregate performance at higher levels of organization, such as a the city and national level.
Define # of simulation units, connectivity between units, schedule of transaction events, schedule of reaction events, initial conditions.
Output aggregate performance for groups of units.
Build top-down scenario: The present day scenario is built in a top-down fashion from various government data sources. Statistics are only tracked from relatively high levels on the organizational hierarchy, so we must extrapolate some data to flow down to fill the detailed subcells of the structure.
Define high-level consumption rates for groups (using publicly tracked & available data), provide distribution histograms for each type of resource & transaction rates for each subunit.
Output unit-level quality of life, performance.
Execution of simulation model to produce output data.
Postprocessing & analysis of output data into performance metrics.
Design-of-Experiments method of parametric analysis for solution space exploration & optimization.
Rhapsody can organize things into collections called packages, which roughly correspond to namespaces in C++. This allows elements to be sorted and separated cleanly.
The basic model consists of an overall package named GeneralHabitat, which contains base classes and three more packages to organize resources, reactions, and transportation methods.
GeneralHabitat Package
Generalized resource queuing and transportation model of living support systems.
A scenario is required to build up a model of a system by creating a hierarchy of cells that connect to each other via transportation network infrastructures. These cells then begin to perform resource transactions between each other and resource reactions within themselves to simulate the daily operations of the system and observe it from different levels of detail, scaling from the individual to the city to the world. The transaction approach is well suited for implementation in a discrete event simulation.
Much of the model is static, such as monetary costs for resources or the structure of cells. This model is not intended to perform dynamic economic simulations or find ecological balances between the deaths and birth rates of people or towns; those functions have been well studied. (That said, the nature of the event-driven simulation framework makes it easy to patch in such functionality by manipulating variables or cleverly reorganizing the scenario outside of the simulation.)
Instead, this model is merely intended to construct an overglorified spreadsheet used to perform preliminary design and calculate rough benefits analysis on changes to ways of life, quantifying answers to such questions as: "how much energy might a city save if everyone installed more efficient light bulbs?" or "how much time can we save if we staggered a city's work schedule to relieve rush hour congestion?"
The GeneralClasses object model diagram (Rhapsody's internal name for a UML class diagram) depicts the base simulation classes and generally encompasses the entire design of the simulation. All object model diagrams following this would actually constitute scenario-specific use cases that highlight the use of the base simulation classes.
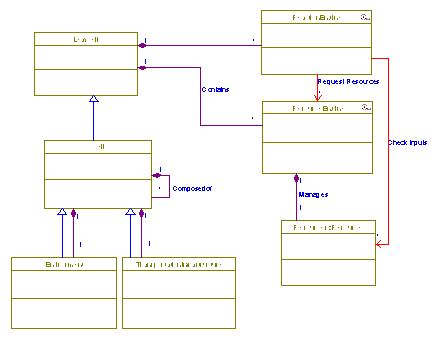
Figure 3: GeneralClasses OMD
Nested Packages:
Resources
CellHierarchy
Transportation
Reactions
The fundamental unit of structure. Each cell represents an identifiable entity, which contains its own collection of resources. These resources can be traded with other cells, or undergo reactions within the cell to transform groups of resources into other types of resources.
Generally, there are five basic types of cells that work together: The entity itself, the entity's environment, the entity's transportation infrastructure, and leaf cells to represent individuals and industries.
To further complicate matters, entities are arranged into hierarchies of subcells. This allows us to view the system on several levels of detail, from global down to the individual. To do this, we introduce the constraint that a cell's resources always equals the sum of the resources of all of its child subcells.
Relations:
itsSubCell
Each branch cell may contain several subcells
Composedof
Composition of Cell, Multiplicity of *, Bi-directional
itsCell
Composedof
Association with Cell, Multiplicity of 1, Bi-directional
itsEnvironment
Composition of Environment, Multiplicity of 1, Bi-directional
itsTransportationInfrastructure
Composition of TransportationInfrastructure, Multiplicity of 1, Bi-directional
Superclasses:
LeafCell
Public
Subclasses:
City
Community
Environment
Household
Nation
Region
TransportationInfrastructure
World
Leaf cells are a special type of cell reserved for individuals and industries. These cannot be subdivided further into subcells, and thus lack an environment or a transportation infrastructure to support those subcells.
Relations:
itsResourceEngine
Contains
Composition of ResourceEngine, Multiplicity of *, Bi-directional
itsReactionEngine
Composition of ReactionEngine, Multiplicity of *, Bi-directional
Subclasses:
Cell
Individual
Industry
We model the area of interest by breaking it down into a hierarchy of cells and subcells that work at a different level of detail. There are essentially two types of units, parent nodes and leaf nodes, with the only distinction being that leaf nodes do not have any subcells. One possible scheme for defining this hierarchy is presented in the CellTypes class diagram. It's important that all of the subcells add up exactly to form the parent cell, so in some cases, it would be necessary to define subcells that represent everything that might be left over after allocation into existing subcells. For example, the rural areas not part of a city would be lumped into a special residual "City" subcell to be included as part of a "Nation". Similarly, homeless people and vagrants would be lumped together into a special "Household" or "Community" subcell to be included as part of "City" data. This should be an acceptable practice, since these units may tend have similar characteristics.
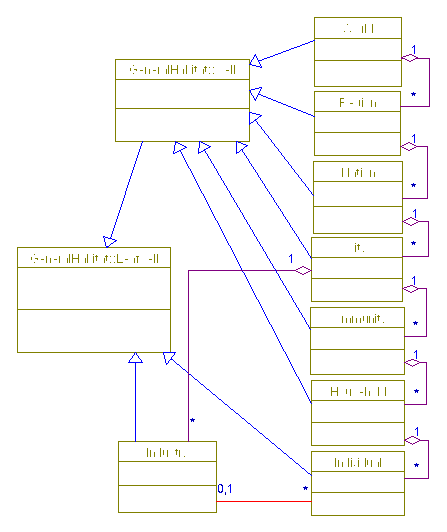
Figure 4: CellTypes OMD
The limits of the size of the system. Of course, the architecture of the model is left open to envelop interplanetary commerce between worlds in the distant future.
Relations:
itsRegion_1
Aggregation (me as the whole part) of Region, Multiplicity of *, Bi-directional
Superclasses:
Cell
Public
A geographic region would tend to be composed of several nations with a common situation. Of course, large nations may exist over several regions. For our purposes, we'll simplify by assuming all nations are smaller than the regions they are in.
Relations:
itsWorld_1
Association with World, Multiplicity of 1, Bi-directional
itsNation
Aggregation (me as the whole part) of Nation, Multiplicity of *, Bi-directional
Superclasses:
Cell
Public
A nation sets the policy for international trade and commerce. Plus, data is often available on the national level for input into the top-down models.
Relations:
itsRegion
Association with Region, Multiplicity of 1, Bi-directional
itsCity
Aggregation (me as the whole part) of City, Multiplicity of *, Bi-directional
Superclasses:
Cell
Public
A city would be the highest level of organization represented by an individual arcology. Several cities would be interconnected to form a nation. One "city" cell unit can be put aside to account for all rural areas not included in other cities.
Relations:
itsNation
Association with Nation, Multiplicity of 1, Bi-directional
itsCommunity
Aggregation (me as the whole part) of Community, Multiplicity of *, Bi-directional
itsIndustry
Aggregation (me as the whole part) of Industry, Multiplicity of *, Bi-directional
Superclasses:
Cell
Public
Families tend to cluster into communities, which in turn form cities.
Relations:
itsCity
Association with City, Multiplicity of 1, Bi-directional
itsHousehold
Aggregation (me as the whole part) of Household, Multiplicity of *, Bi-directional
Superclasses:
Cell
Public
A household would consist of a family of several individuals living together in one residence.
A family doesn't necessarily include extended family, or preclude the existence of other arrangements such as roommates.
Relations:
itsCommunity
Association with Community, Multiplicity of 1, Bi-directional
itsIndividual
Aggregation (me as the whole part) of Individual, Multiplicity of *, Bi-directional
Superclasses:
Cell
Public
A leaf node in the hierarchy, the Individual cannot be broken down into any more subcomponents (we can only hope). Most individuals will also work for an industry.
Individuals are free to move from place to place as part of their daily lives. This allows them to commute to work or to visit friends in another household and transfer their resource consumption to stress the infrastructure at other locations.
When individuals travel, it puts a strain on the transportation infrastructure.
Relations:
itsHousehold
Association with Household, Multiplicity of 1, Bi-directional
itsIndustry
Association with Industry, Multiplicity of 0,1, Bi-directional
Superclasses:
LeafCell
Public
Cities have a special type of leaf node called Industry, which essentially employ several Individual units to perform certain specialized reactions on particular resources in bulk. Generally, they consume energy resources to refine material resources.
Relations:
itsCity
Association with City, Multiplicity of 1, Bi-directional
itsIndividual
Association with Individual, Multiplicity of *, Bi-directional
Superclasses:
LeafCell
Public
A special passive cell that will always yield any resources that it has and accept any waste that is ejected into it. Instead of interacting with other cells on the same level, it only interacts with subcells. So, for example, a nation's resources can be split amongst its cities, and city level waste gets deposited in the nation's environment (as opposed to some other nation's environment).
Relations:
itsCell
Association with Cell, Multiplicity of 1, Bi-directional
Superclasses:
Cell
Public
A special cell that interacts with subcells. It represents the connective tissue that allows resources to transit between subcells, and it takes both money and fuel in the process. Several types of transportation infrastructures can be defined with different characteristics in terms of resource burn rates.
Relations:
itsCell
Association with Cell, Multiplicity of 1, Bi-directional
Superclasses:
Cell
Public
Subclasses:
Cargo
Pipeline
Radio
Wire
Attributes:
Maintenance
Monetary maintenance cost incurred to keep this system up and running per unit cycle.
Type of double, Public
TransitCost
Monetary cost required to move a unit of resource through this transportation infrastructure per unit distance.
Type of double, Public
Value
Infrastructure build value, how much money needs to be invested to put this transportation infrastructure in place so it can be used.
Type of double, Public
The transportation network serves as connective tissue that joins the nodes of the structure together. It is up to the scenario to define the connectivity graph, but once accomplished this will compute the overhead in terms of resource burn to transfer individuals and cargo through the network.
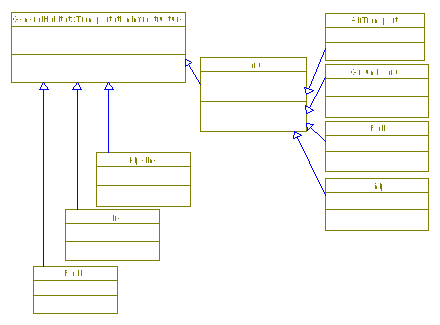
Figure 5: ConnectiveTissue OMD
A generalized form of transportation for passengers and cargo. Only these forms of transportation can handle material goods and individuals.
Superclasses:
TransportationInfrastructure
Public
Subclasses:
AirTransport
GroundCargo
Rail
Ship
Attributes:
NetworkCapacity
The number of transport units the transportation infrastructure can handle. As network capacity approaches this number, congestion effects set in.
Type of int, Public
numUnits
Number of transport units actively using the system at any given time. When this number nears the NetworkCapacity, congestion delays set in which begin to cut into the efficiency of the system.
Type of int, Public
Expensive but fast, and often must be used in a multimodal fashion, where households must transfer their wares up to the city level first before making airhops between cities.
Superclasses:
Cargo
Public
Well connected, reaching every location with road coverage.
Superclasses:
Cargo
Public
High initial infrastructure costs and not very well connected, but fairly economical once everything is in place.
Superclasses:
Cargo
Public
Only a boon to certain cities, and requires some contention for port infrastructure.
Superclasses:
Cargo
Public
Pipeline infrastructure is good for transporting fluid commodities, such as water, natural gas, sewage, etc.
Superclasses:
TransportationInfrastructure
Public
Distribution system for electricity and information
Superclasses:
TransportationInfrastructure
Public
Distribution system for information
Superclasses:
TransportationInfrastructure
Public
This package defines reactions that can occur within cells to transform one set of resources into another set of resources. The definition of the reaction governs changes to the quantities of inputs and outputs, and balances them the same way a chemical reaction would be balanced.
The icons in the top right of some of the classes indicate that those classes have activity diagrams associated with them. These diagrams can be viewed in the corresponding System Behavior section. The specific reactions on the right inherit the activity diagrams from parent classes, where they can be extended. The "Refining" class appears to have "lost" its activity diagram, though, probably due to a bug in the way Rhapsody inherits statecharts; it should be possible to fix by deleting the class and recreating it.
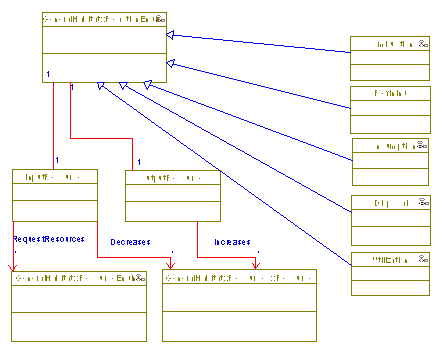
Figure 6: ReactionTypes OMD
This diagram highlights one of the reactions in detail. Other reaction types would look very similar to this diagram with different combinations of input and output resources.
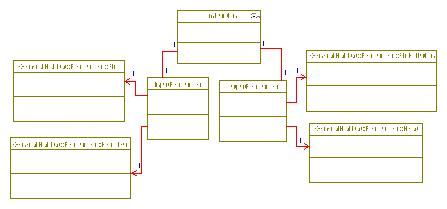
Figure 7: CombustionReaction OMD
This package details the various generalizations of resources available in the model.
A particular resource of interest that can be contained, traded, or reacted within cells.
Relations:
itsResourceEngine
Manages
Association with ResourceEngine, Multiplicity of 1, Bi-directional
Subclasses:
Fuel
Information
Money
Waste
Attributes:
Qty
Type of double, Public
Unit
Type of OMString, Public
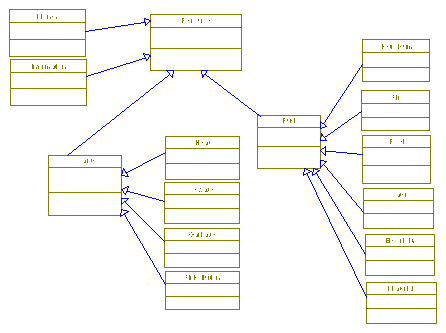
Figure 8: ResourceTypes OMD
Financial resources are often exchanged for goods and services, so it's worth tracking how much each cell has on reserve.
Superclasses:
Resource
Public
Information can also be transferred and accounts for education activities or entertainment.
Superclasses:
Resource
Public
The Fuel superclass generally refers to any resource that is useful.
Superclasses:
Resource
Public
Subclasses:
Air
Electricity
Food
Material
Petroleum
Water
Rather than get too specific in chemistry terms, this class represents clean useful air for breathing or to provide oxygen for combustion.
Superclasses:
Fuel
Public
Electrical distribution is one of the oldest networks in the world and serves as a catalyst for many other useful reactions, or merely as a utility to improve the quality of life.
Superclasses:
Fuel
Public
Anything people can eat.
Superclasses:
Fuel
Public
Any kind of object or artifact that might be transferred. Along with the mass value inherited from resource, material can also have a value density, which can increase with the refinement reaction to represent a lot of what industry does.
Superclasses:
Fuel
Public
More traditional fuel products that are not necessarily restricted to oil or derivatives. Anythings that burns to produce energy could be included, such as coal and wood.
Superclasses:
Fuel
Public
Clean potable water for drinking or for maintenance.
Superclasses:
Fuel
Public
Superclass that represents byproducts that cells probably don't want to keep around, but that need to be tracked and disposed of appropriately. Waste can still put a load on the transportation infrastructure, and require industrial resources to treat and refine properly.
Superclasses:
Resource
Public
Subclasses:
AirPollution
Garbage
Heat
Sewage
Any kind of gaseous waste.
Superclasses:
Waste
Public
Solid waste products, mostly discarded materials.
Superclasses:
Waste
Public
Otherwise known as entropy, almost every process surely creates waste heat that needs to be dissipated.
Superclasses:
Waste
Public
Liquid waste that might be drained through the sewage system.
Superclasses:
Waste
Public
The simulation model is based on a discrete event simulation engine. This means that state changes in the system structure are triggered by the firing of events which occur along the global time line queue. The model executes by populating the global time queue with scheduled events and firing those events in order. Every time an event is activiated, the system global time is advanced to that time. Any state transitions in the model that were blocking on this event are executed so they can perform their activities, which often result in the scheduling of more events in the future. Thus the simulation perpetuates events and continues in time until there are no more events left on the simulation queue.
Event signalling that the person should make an attempt at going somewhere to eat.
Event signalling person to go somewhere (preferably home) so they can sleep.
Event signalling a person to wake up and begin their day.
The individual transitions from state to state in their daily activities triggered by these events. A fairly simple schedule could be arranged as follows to implement a statechart representing a typical person's day. The statechart depends on having the right combination of events defined and triggered to advance the individual through the full daily cycle.
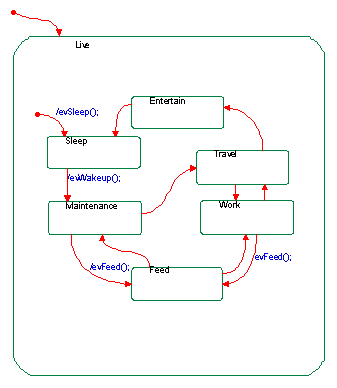 Statechart
ROOT
Or-state
Substates:
Live
Default Transition
Target:
Live
Live
Or-state
Substates:
Entertain
Feed
Maintenance
Sleep
Travel
Work
Default Transition
/evSleep();
Target:
Sleep
Entertain
Or-state
Out Transition
Target:
Sleep
Feed
Or-state
Out Transition
Target:
Maintenance
Out Transition
Target:
Work
Maintenance
Or-state
Out Transition
/evFeed();
Target:
Feed
Out Transition
Target:
Travel
Sleep
Or-state
Out Transition
/evWakeup();
Target:
Maintenance
Travel
Or-state
Out Transition
Target:
Work
Out Transition
Target:
Entertain
Work
Or-state
Out Transition
/evFeed();
Target:
Feed
Out Transition
Target:
Travel
Each resource engine keeps track of the flow of one resource within a cell. This includes the input of resource from the environment, trade of resources with other cells, internal reactions that transform resources to and from other resources, and waste resource output back to the environment.
The resource engines are initialized to fire push/pull transaction events at regular intervals. Pull transactions would offer to exchange monetary resources for goods and services such as food or electricity. Push transactions relate to the expulsion of waste, and would end up in the immediate environment unless picked up by a transportation system to take to, say, a waste processing plant (represented by an industry) first.
Relations:
itsResource
Each ResourceEngine manages the quantity of one resource for each Cell unit through transactions in/out of the environment, trade with other Cell units via connective transportation cells, or internal reactions within a Cell.
Manages
Composition of Resource, Multiplicity of 1, Bi-directional
itsLeafCell
Contains
Association with LeafCell, Multiplicity of 1, Bi-directional
Attributes:
Amount
Amount of resource requested per cycle
Type of double, Public
Interval
Time interval between requests
Type of double, Public
Resources essentially attempt three types of transactions:
A request for resources from its parent cell or environment, in client/server pattern.
A peer-to-peer trading agreement scheduled through the scenario setup.
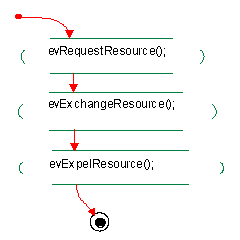 A
dump of resources back to its parent cell or environment.
ROOT
Or-state
Substates:
Expel
Pull
state_3
Trade
Default Transition
Target:
Pull
Expel
Push transaction to deposit waste into the waste management infrastructure (or the environment).
Action State
EntryAction
evExpelResource();
Out Transition
Target:
state_3
Pull
During initial scenario setup, set a starting
Action State
EntryAction
evRequestResource();
Out Transition
Target:
Trade
state_3
Local Termination State
Trade
Transaction to exchange resource with another cell on the same level.
Action State
EntryAction
evExchangeResource();
Out Transition
Target:
Expel
Resources are required to fuel several reactions that occur within a cell. These reactions are driven by the reactionengines associated with a cell to consume several resources and turn them into other resources and waste.
When enough of the input resources become available, the reaction event can commence. Otherwise, the reaction engine asks the resource engine to request the required resources through pull transactions.
Several reaction types are available, but the assigment and scheduling of reaction events is up to the scenario builder.
Relations:
itsLeafCell
Association with LeafCell, Multiplicity of 1, Bi-directional
itsResourceEngine
Request Resources
Association with ResourceEngine, Multiplicity of *, Uni-directional
itsResource
Check Inputs
Association with Resource, Multiplicity of *, Uni-directional
itsInputResources
Association with InputResources, Multiplicity of 1, Bi-directional
itsOutputResources
Association with OutputResources, Multiplicity of 1, Bi-directional
Subclasses:
Combustion
Consumption
Disposal
Refining
Utilization
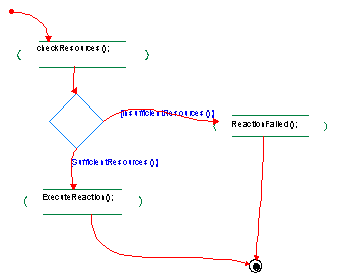
ROOT
Or-state
Substates:
state_0
state_1
state_2
state_3
Default Transition
Target:
state_0
state_0
Poll input resources to see if there are enough raw materials ready to undergo the reaction.
Action State
EntryAction
checkResources();
Out Transition
Condition Connector
Branches:
[SufficientResources();]
Target:
state_2
[InsufficientResources();]
Target:
state_1
state_1
Record an appropriate penalty for a failed reaction. If no penalty action is defined, then the failure is merely recorded. These failures could then lead to a detraction in the quality of life output metric.
Action State
EntryAction
ReactionFailed();
Out Transition
Target:
state_3
state_2
Reduce input quantities and increase output quantities in the ratio defined in this reaction.
Action State
EntryAction
ExecuteReaction();
Out Transition
Target:
state_3
state_3
Local Termination State
Proxy to ReactionEngine that requests or collects resources available within the cell.
Relations:
itsReactionEngine
Association with ReactionEngine, Multiplicity of 1, Bi-directional
itsResource
Decreases
Association with Resource, Multiplicity of *, Uni-directional
itsResourceEngine
RequestResources
Association with ResourceEngine, Multiplicity of *, Uni-directional
itsCombustion
Association with Combustion, Multiplicity of 1, Bi-directional
itsAir
Association with Air, Multiplicity of 1, Uni-directional
itsPetroleum
Association with Petroleum, Multiplicity of 1, Uni-directional
Proxy to ResourceEngine that increases associated output resources upon successful reactions.
Relations:
itsReactionEngine
Association with ReactionEngine, Multiplicity of 1, Bi-directional
itsResource
Increases
Association with Resource, Multiplicity of *, Uni-directional
itsCombustion
Association with Combustion, Multiplicity of 1, Bi-directional
itsAirPollution
Association with AirPollution, Multiplicity of 1, Uni-directional
itsHeat
Association with Heat, Multiplicity of 1, Uni-directional
Reaction in which air and petroleum fuel combine to produce waste gas (air pollution) and heat. Often a catalyst for operating the various forms of cargo transportation.
Relations:
itsInputResources_1
Association with InputResources, Multiplicity of 1, Uni-directional
itsInputResources_2
Association with InputResources, Multiplicity of 1, Bi-directional
itsOutputResources_1
Association with OutputResources, Multiplicity of 1, Bi-directional
Superclasses:
ReactionEngine
Public
The activity diagram for Combustion is grey to indicate that it was inherited from a parent class. Any changes to the inherited activity diagram would have shown up in color.
ROOT
Or-state
Inherited
Substates:
state_0
state_1
state_2
state_4
Default Transition
Inherited
Target:
state_0
state_0
Action State
Inherited
EntryAction
checkResources();
Out Transition
Inherited
Condition Connector
Branches:
[SufficientResources();]
Target:
state_2
[InsufficientResources();]
Target:
state_1
state_1
Action State
Inherited
EntryAction
ReactionFailed();
Out Transition
Inherited
Target:
state_4
state_2
Action State
Inherited
EntryAction
ExecuteReaction();
Out Transition
Inherited
Target:
state_4
state_4
Local Termination State
Process taking in materials and energy as input and outputting refined, higher quality material.
Superclasses:
ReactionEngine
Public
Reaction diagrams for Refining and the rest of the reactions would look similar to combustion, with different combinations of resources connected to the Input and Output classes.
As with everything else in this design document, a distinction must be made between requirements for the arcology and requirements specific to the arcology simulation model (the actual system of interest). The ability for the simulation to successfully model the fulfillment of fundamental arcology requirements is in itself a requirement.
The simulation tool should be able to quantify estimates for real life occurrences. One of the odd requirements for this system is to provide special failure cases in the event that all of an individual's use cases cannot be met. While the consequences for failure to fulfill a need (such as starvation, homelessness, or sickness do to poor hygiene – all very real-world problems) does not necessarily have to be simulated to achieve its purpose in the system, failures do need to be noted and become part of the output of the system. It is of interest to note that failure is an option, and must be properly accounted for as part of the normal operation of the system.
We present separate requirements for the archology and the simulation model. The simulation requirements are driven by the ability to model interactions between elements that affect the archology requirements, so they may be seen as further derived.
Attend to basic occupant needs defined in the Individual use cases described in Live.
Provisions (Feed)
Food
Water
Other consumables (vitamins, nutrients, etc.)
Indirect assets & qualities
Shelter, security (Sleep)
Health, hygiene maintenance not covered by (Maintenance)
Waste removal
Self-sufficiency & sustainability (Work)
Extract required resources from environment
Extract labor from occupants
Improve quality of life for occupants (Entertain)
Education
Entertainment
Social interaction
Transformations of resources
Fuel to Waste - byproducts of Arcology Requirements
Construction / deconstruction mechanism - resulting from
Accounting & transportation mechanism for resources
Solid - Arcology Requirements
Liquid - Arcology Requirements
Gaseous - Arcology Requirements
Information - Arcology Requirements ,
Monetary credits - intermediary between exchanges and transformations.
Transportation mechanism for resources & occupants in order to satisfy all of the above (Travel)
Insert scenarios as inputs
Numbers of units involved (people, transportation mechanisms, industrial entities, etc.)
Available resources from environment, initial conditions
Resource conversion rates, schedules, functions
Simulation execution - model resource consumption/production rates, providing estimates on actual performance (pending validation of model)
Output metrics defined and calculated
Qualitative measures of performance
Quantitative measures of performance
Allow possibility for formulating optimization problems to aid in benefits analysis & decision-making in arcology design.
Significant events (to be defined by modeling use case scenario case studies) should be modelable by scenario architecture – important activities that have impact on performance measures should not be ignored. Should provide at least approximate methods of simulating effects that are difficult to model.
Specification of accuracy in estimates & predictions. (Goal of ~20%)
The simulation system is capable of supporting both present day and arcology scenarios. In order to justify the derived simulation requirements, we'll perform a traceability exercise by attempting to map real world data onto the model.
This data from Energy Action provides Fuel consumption on several levels, including world, regional, and national. The cumulative value for World would be fed into the top level cell. 4 subcells would be created below it to contain the regions North America, Europe, Asia Pacific, and one to contain everything else. On the national level, we can again create two subcells of North America; one to represent the USA and one to hold accounting information for Canada, Mexico, and Latin America combined.
Million tonnes oil equivalent - 1999
|
|
Now by cross-referencing population statistics for the year 1999 from the International Energy Annual reference, we can arrive at the following rough per-capita statistics:
|
|
|
|
|
|
Population (millions) |
Total Fuel Consumption |
Per capita |
|
|
USA |
272.69 |
2204.9 |
8.0857 |
|
N Amer |
400.52 |
2557.3 |
6.3849 |
|
Europe |
863.73 |
1800.4 |
2.0844 |
|
Asia Pac. |
3,375.40 |
2255 |
0.6681 |
|
Other |
1,352.48 |
1920.7 |
1.4201 |
|
World |
5,992.13 |
8533.4 |
1.4241 |
|
|
|
|
|
Despite the wide range of per capita usage, the subpartitioning of the cell hierarchy ensures that groups of like individuals are distributed near each other, so we don't smooth too much of the complexity out of the real system. This will allow us to model the dynamics of, say, having an energy-hungry populace concentrated in one part of the world.
We can further use Energy Information Administration data to specify energy utilization breakdown for residential, commercial/industrial (we need not make a distinction for our purposes), and transportation uses.
Finally, the reaction equations can be used to close the loop on the system and estimate how much waste products were produced that need to be dealt with or absorbed by the environment.
This traceability process ensures that each complexity introduced in the detailed simulation requirements supports a modeling capability requirement that will be used to complete primary requirements and goals.
Again, specifications for the archology and the simulation of the archology presented separately:
Attend to basic occupant needs defined in the Individual use cases described in Live.
Food : > 1.77 kg per diem
Water : > 2.3 kg per diem
Other consumables (vitamins, nutrients, etc.)
Indirect assets & qualities
Shelter, security : distribution of 5 - 10 hours of sleep, personal living quarters with > 37 m2 of personal living space.
Health, hygiene maintenance not covered by – timely delivery of emergency supplies & services.
Waste removal – roughly equivalent to total of Provisions.
Self-sufficiency & sustainability
Extract required resources from environment – varies, should balance with environmental production rates, if known.
Extract labor from occupants – a distribution of around 1/3 of the daily cycle. Provide > 19 m2 of work space.
Improve quality of life for occupants : maintain or increase amount of leftover time dedicated to the following:
Education
Entertainment
Social interaction
Transformations of resources
Fuel to Waste – roughly 1 to 1 conversion factor by mass.
Construction / deconstruction mechanism –
Accounting & transportation mechanism for resources – Conversion, creation, consumption of each class of resource.
Transportation mechanism for resources & occupants –
Quantify measures of effectiveness – cost, latency, throughput, efficiency
These mostly deal with measures necessary to create hardware and programming efficiency requirements for successful execution, and have little else to do with the planning or setup of the model. Therefore, we won’t dwell too much on these, but provide a placeholder for lower-level specification by software engineers.
Ability to model baseline scenario on the order of magnitude of ~1010 units processing a 24 hour period of events on currently available computer hardware.
Attain a reasonable execution time of less than 10 hours to process the scheduled event queue such that the baseline scenario, assuming ~100 events per unit during the 24 hour period.
Achieve real time or faster simulation speed of the baseline scenario.
This simulation model will essentially be a scoring system in and of itself, as it provides output parameters that can be combined to form a composite score. Analytic Hierarchy Process would probably not be appropriately applied here, since the model produces quantitative results well suited for the scoring process, and is not so much intended to rank cities based on their performance.
The simulation system culminates in the ability to reduce piles of data into simple measures of effectiveness that can be used to compare several city designs or evaluate several potential changes to the operation of one city, and also reflect its impact on both higher levels of organization on down to the low levels of individual life.
Since most of the measures of effectiveness are ratios that range between 0 and 1, there are no concerns about recentering scores or establishing scale factors. Breaking down metrics to be expressed in this type of nondimensional form has been a longtime stalwart of supporting aerospace engineering research, where oftentimes theorists raised on entirely different unit systems could compare performance based on dimensionless parameters.
The only task remaining to form a composite score is choosing the weights to assign to each performance metric. The scoring method works best when all of the weights are normalized.
For this project, we will perform an example preliminary design tradeoff study focusing on the transportation system used to distribute goods to the population at large.
The optimization is performed using a transportation model that optimizes delivery schedules through a series of equidistant nodes. The nodes are specialized in producing a particular resource, which needs to be distributed to the other nodes that don't have that resource. A common distribution paradigm is to have a large hub that collects all of the resources, and then distributes the complete package to the destination nodes. This works well for relatively small nodes, for example, distributing goods from a city (hub) to its surrounding suburbs. However, as the relative sizes of the nodes increase to the point where adjacent nodes are peers, a different approach may be warranted.
The optimization problem used is a mixed integer / linear program that takes several input parameters characterizing the transportation network topology and demand levels, and outputs an optimal schedule of flights. We will model our demand in terms of unique resources generated at a particular node that must be distributed to all of the other nodes in the system proportional to their population. The problem was originally designed for moving passengers through the airliners, thus the passenger/aircraft terminology. However, the same model could apply just as well to moving freight through a network served by a fleet of cargo vehicles.
As a simplification, we will wrap up all of the user requirements declared in the specifications into a unit package. Therefore, every unit that makes it through the transportation network will satisfy part of the requirement for one individual in the system.
In general, the complete city system can only improve properly if we choose the right performance metrics to judge it by. An optimization function that optimizes the wrong metric will certainly cut you short of fulfilling your goals. For a city, the metrics we would want to track include:
Resource production / consumption ratio per cell. An effective system would need to be efficient at doing a lot with the resources it has available to consume. The emphasis should not be merely on stinginess with resources, because that can only cause stagnation.
Transportation overhead – Establish metrics to track the ratio of resources spent on the connective infrastructure compared to the nodes and activities it actually supports. Of course, this also needs to be balanced with the need for growth and interconnectivity, so it should be considered secondary to productivity.
Sustainability – The environment is usually the first to give resources or absorb waste when they are not serviceable elsewhere. However, it is often not well known what the capacity of the environment to perform restorative reactions on waste resources to turn them back into useful resources. The burden should be placed on the industries who exercise the environment the most to prove what its capacity is, and to achieve a suitable equilibrium.
Quality of life – This can be measured by tracking the rate of failed reactions scheduled by the population to maintain their desired standard of living. Of course, this is dependent upon how high that initial standard is set. The only qualification for this model is to attempt to keep the quality from dropping below former levels.
Define a distribution system topology. All nodes will be fully connected, but have different hub/node size ratio. What characterizes the difference between hubs and ordinary nodes? Hubs will have higher transit demand levels as well as larger throughput limitations.
Number of people per node ratio. For the same total population, is it better to have them distributed across several nodes, or occupy relatively few. This will likely be dependent on throughput limitations.
Population / number of transport vehicle ratio. For the same total population, is it better to have fewer vehicles working complex routes, or many vehicles working in parallel.
The following criteria form the core of the multi-criteria optimization performed for tradeoff studies.
Maximize profit of running the system, represented by the total freight revenues less the total cost of operating the fleet of vehicles. Revenue is generated by sending a unit of cargo to its destination. A flat cost characterizes the expenses of each segment that the cargo haulers travel. Plus, another flat cost characterizes daily maintenance expenses for having the vehicle in operation, to encourage the schedule to use fewer vehicles if possible.
Maximize the coverage & service of the system (minimize the number of unserved people). Usually it's unprofitable to transport the last few units of cargo left at a node for the day, since they don't fill up the cargo holds enough to offset the fixed cost of the journey. Minimizing this criteria attempts to serve all of these "leftover" bits at an operating loss if necessary.
Minimize the deviation from an arbitrary desired fleet size. A somewhat artificial metric, this criteria attempts to find a solution using a specific number of vehicles. Often, the solution would require more vehicles than you may have in operation, and you would want to avoid temporarily leasing if possible, even if it affects the other optimization criteria. On the other hand, the profit optimal solution may require less vehicles than you have in your fleet, but union labor mandates or other reasons may drive you to want to use those vehicles anyway without giving them a throwaway schedule.
A computer script in PERL generates the optimization problem and performs the multi-criteria optimization runs to populate trade study curves. The source is listed in appendix A, and an example of its output is listed in appendix B. The model is written in the LINDO-esque lp_solve model format, but is then converted to the industry-standard .mps format so just about any MIP solver can tackle it. However, the formatting of the variable names is tuned to accept the input format of GNU glpk, the particular MIP solver used.
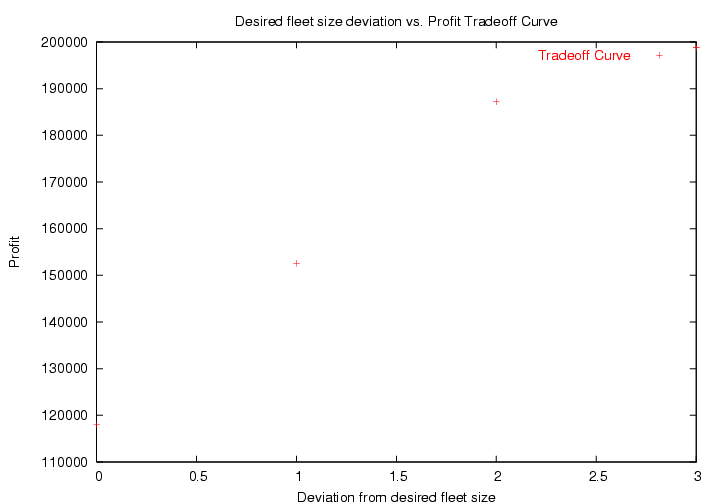
We start by optimizing for the minimum deviation from the desired fleet size. The desired fleet size is set pretty low, to 2, in order to get several points. The optimal fleet size given by optimizing most of the other metrics is 6, so by relaxing the deviation from desired fleet size constraint, we can get a feel for the pareto optimal curves.
Allowing the deviation to increase allows us to serve more customers, until all of them have been accounted for. This looks fairly linear now due to the small number of nodes and aircraft involved.
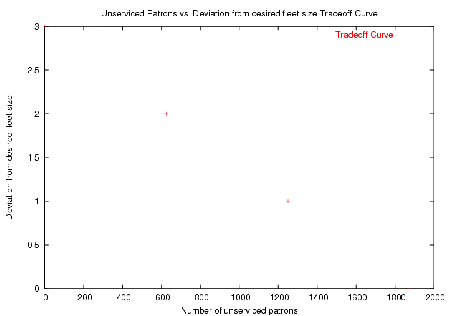
Profit also increases as we are allowed to utilize more vehicles:
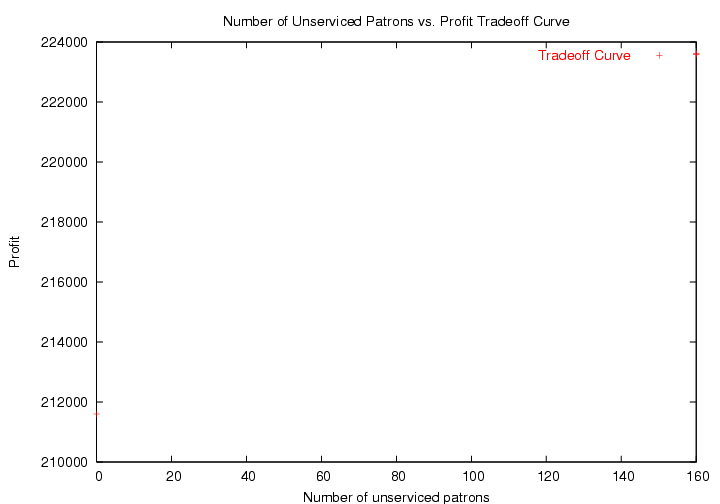
Finally, we see that we can increase profit margins by serving less people at a loss.
Verification testing of the archology simulation engine would consist of running through a series of test cases presented in a test package. Testing will likely occur in phases, each which primarily concentrate first on testing pieces of the core discrete event simulation building blocks defined in the GeneralClasses object model diagram, and then on testing the integrated interactions of scenarios built using those classe, broken down as follows:
The ability of the program to set up scenarios using the basic building blocks of units, partitioning them into smaller sub-units, each containing resources.
The ability for units to exchange resources based on processing transaction events from the event queue.
The ability for units to internally convert resources into other resources based on processing reaction events from the event queue.
The placement of the transportation network to apply constraints on the connectivity of the units. The transportation links should also be represented as units, so that they may consume resources themselves in the course of delivering their cargo.
The successful execution of a simple example scenario.
Insert scenarios as inputs
Simulation must read input files and populate data structure. Provide printout mechanism to dump state of data structure for verification of the following capabilities:
Numbers of units involved (people, transportation mechanisms, industrial entities, etc.)
Unit test scenarios:
Create two peer units with transportation connector unit between them
Create several nested subunits within a superunit. This is illustrated in the Figure 4: CellTypes OMD diagram.
Available resources from environment, initial conditions
Unit test scenarios: (refer to Figure 9: ResourceTest)
Create two different resources inside a unit
Create & verify two different resource quantities in a unit and a nested subunit
Place maximum resource capacity constraints on a unit
Create an environment unit, which can optionally act as an unlimited source and sink for various resources.
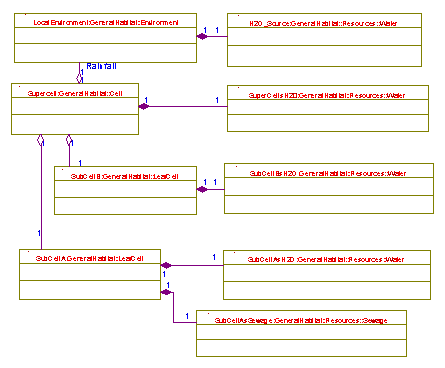
Figure 9: ResourceTest
Resource conversion rates, schedules, functions
Event queue test scenarios:
Process resource conversion event within a unit to transform a quantity of resource into an equivalent quantity of waste. See Figure 7: CombustionReaction OMD for an example.
Process a push-based resource conversion event, where a multitude of inputs are converted to a multitude of outputs at the specified conversion ratio until one or more of the input resources are exhausted.
Process a pull-based resource conversion event, where a multitude of inputs are converted to a multitude of outputs at the specified conversion ratio until either: 1) the requested output quantity is achieved, or 2) one or more of the input quantities is exhausted, resulting in a lower yield than requested.
Process a unit transaction event, in which a specified quantity of a resource is transferred from one unit to another unit to which there is connectivity through the transportation network. The total quantity of resource in the system must be conserved. See Figure 10: TransactionTest below:
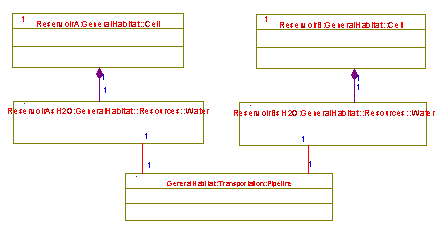
Figure 10: TransactionTest
Test planning function events, which monitor the internal resource state of a unit and schedule more resource conversion events or transaction events on the queue at regular intervals and based on triggers
Simulation execution - model resource consumption/production rates, providing estimates on actual performance (pending validation of model)
After individual unit tests & operations have been verified, attempt to load and run a simple but complete simulation scenario. Given inputs of a unit topology, initial resource distribution, and a queue of events, verify that simulation ends in the correct final state. See Figure 11: ScenarioTest
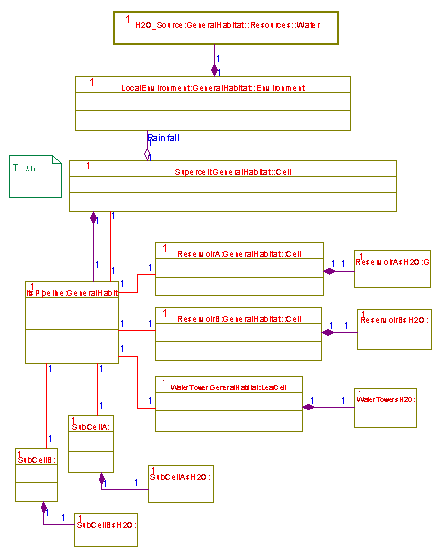
Figure 11: ScenarioTest
Output metrics defined and calculated
Simulation engine must have a logging and output mechanism. Logging events consist of polling functions that sit on the event queue, passively poll the state of the system when executed, and log the data to a file. The logging functions should not affect the state of the simulation in any way during the course of their execution.
Qualitative measures of performance
As this simulation primarily performs counting, most of the metrics will be quantitative. However, some qualitative metrics gathered could include:
Error flag. If a function within the simulation throws an exception, the entire simulation run should be marked as tainted. This flag could also be raised when certain preconditions fail, for example, if a unit somehow ends up with a negative quantity of resources. This type of situation could potentially allow the simulation to continue running, without any indication an error had occurred.
Quantitative measures of performance
Most metrics gathered by the logging functions would take snapshots of:
The state and topology of the unit mesh
The amount of resources in each unit
The total amount of resources that has been transferred over a transportation link
Deficiency reports on amounts of resources that have been “pulled” from a unit, but upstream nodes were not able to provide enough resources.
Congestion reports on amounts of resources that were unable to be “pushed” to downstream nodes without violating their maximum resource capacity constraints.
Allow possibility for formulating optimization problems to aid in benefits analysis & decision-making in arcology design.
Optimization can take place in the planning function events that schedule and place new events on the simulation event queue. While the algorithm can vary, we can test the ability for the planning function event to affect the scheduling of future events. The planning functions must have the ability to:
Query the event queue for future scheduled events
Cancel an event in the event queue, but only if the event occurs in the future. It cannot cancel events that have already been executed.
Place new events on the event queue at an arbitrary future time.
Significant events (to be defined by modeling use case scenario case studies) should be modelable by scenario architecture – important activities that have impact on performance measures should not be ignored. Should provide at least approximate methods of simulating effects that are difficult to model.
This requirement affects the ability of the simulation core engine to assemble itself with enough complexity to create a valid model of the system, and is thus in part tied to the validation of the engine. At a minimum, the simple building blocks of units, transportation connectivity, resources, conversion events, and transaction events must be flexible enough to be composed into more sophisticated structures with complex behaviors
For example, let us attempt to model the transportation of a resource from unit A to unit B. In the simplest case, they have a transportation network link between them, and a resource transaction event fires to transfer the specified quantity of resource from A to B. End of story.
In a more complicated scenario, we might want to model different mechanisms to transport those resources from A to B, so we’ll use the basic building blocks to model the resources being loaded up, say, into a series of truck units. The truck units would start with a transportation connectivity link to unit A, and a quantity of resources will be loaded up to the truck’s capacity. The truck would then disembark, firing a reaction that disconnects its transportation link to A, and schedules a new transportation connectivity link to B at its arrival time. It would also trigger a resource consumption event that would allow it to burn fuel enroute as a function of cargo weight and distance between A and B.
The simulation core building block units would need to demonstrate this sort of composability to pass this verification test.
Specification of accuracy in estimates & predictions. (Goal of ~20%)
This is related to an output metric. The simulation engine would need a self-monitoring performance metric to keep track of the buildup of standard uncertainty errors to estimate a system-wide predictability error. As the simulation proceeds with its projections, the errors will compound to a point where it is not worthwhile for the simulation to proceed much farther.
Ability to model baseline scenario on the order of magnitude of ~1010 units processing a 24 hour period of events on currently available computer hardware.
An example scenario of such proportions needs to be created and loaded into the simulation engine without exceeding the memory or storage limitations of the target computer platform.
Attain a reasonable execution time of less than 10 hours to process the scheduled event queue such that the baseline scenario, assuming ~100 events per unit during the 24 hour period.
The example scenario needs to be created with the appropriate number of events of “average” complexity.
Achieve real time or faster simulation speed of the baseline scenario.
Validation of the archology simulation tool occurs when it can be used to build models of archology systems. These models would represent some function performed in a real life habitat system, and its behavior and results would in turn need to be validated against performance metrics collected from the actual system it represents. Since we cannot directly assess the sim tool’s ability to create generic models, the validation evaluations will focus on a range of sample model calibration and validation scenarios. We can measure the performance of the models by comparing them with real world performance. If the models can prove their viability, then the capability of the underlying simulation to build models will have been intrinsically validated.
Since the simulation model essentially deals with discerning large scale effects based on the accounting and execution of small scale actions, we will need to validate models on two levels: macro and micro.
The macro scenarios focus on evaluating the model’s predictions of aggregate changes to the system, e.g., what happens to city-wide energy utilization when the population doubles. At first glance, you might expect the energy use to double. However, if the increase is due to the size of the average household increasing, then things like lighting and air conditioning would be shared among individuals, implying that the increase would be less than double. This process turns out to be as much a calibration step as a validation step.
To go about validating this scenario, you would first want to create a model that measures energy use as a function of household size. Then, to double the population, create a new distribution of household sizes (accounting for both the creation of new houses as well as the increases in existing households). Using the earlier function, we should be able to estimate the new total energy usage based upon the distribution of household sizes, and summing up the energy used per household.
Live historical data containing this information is available in the US census. It will be a stretch, since the census is only taken every decade. Energy utilization is also dependent upon a wide variety of other factors, such as local fluctuations in the cost of power, the development & use of technologies such as efficient fluorescent light bulbs, and of course the proliferation of new power-hungry devices such as personal computers and microwaves. Hence the necessity for the calibration portion of the validation. Calibration for this example scenario can occur by using a “control group” of cities whose populations and distributions of household sizes did not change at all. This would allow us to add a systematic increase/decrease factor to each individual’s energy utilization before factoring in the household growth.
After the model is properly calibrated to agree with a group of baseline cities, we can assess its prediction accuracy by giving it energy and census data for one year, having it project the energy usage a decade later based on that census data, and comparing that to the actual. The percentage error over a range of different cities would give us some evaluation of the level of confidence we can place in its projections.
The micro scenarios, on the other hand, focus on how well the model can handle the accounting of changes on the individual level, to determine if different operations make sense. Listed here are some sample scenarios that should be modelable and give predictable, expected results:
Suppose an individual installs their own power generator (e.g. solar panel) and hooks it into their electrical grid. Their power consumption from the public utility should go down. They may even be able to pump some power back into the public grid.
Another individual does not have a kitchen, and must drive to the nearest food store to “eat-out” every time they need to contend with a hunger event. Their extra fuel consumption should show up on their usage metric.
A commuter in the suburbs moves downtown and begins using public transportation. The impact to their finances, commute time, fuel consumption, trips to the grocery store, and remaining leisure time should show up on their monitored metrics.
Soleri, Paolo; Arcology: The City in the Image of Man; Bridgewood Press 1999
Arcology.com: Architecture + Ecology
Arcosanti: A Prototype Arcology
Francis Frick; A Seaside Arcology for Southern China; University of Hong Kong 2000
http://www.cityfarmer.org/frick.html
Carfree Cities
Ilogix Rhapsody in C++
http://www.ilogix.com/products/rhapsody/rhap_incplus.cfm
Gigabyte's SimCity 2000 Arcology page
http://www.angelfire.com/hi/gigabyte2/arco.html
SimCity 3000 Plus: The First Rowan University SC3000 Site
http://users.rowan.edu/~cull2722/simcity3000.html
The Sims Online
http://www.ea.com/eagames/official/thesimsonline/home/index.jsp?
Energy Action
International Energy Annual Population Table
http://www.eia.doe.gov/emeu/iea/tableb1.html
DOA Energy Information Administration
Artemis Project: Reduction of Imported Consumables for Life Support Maintenance
http://www.asi.org/adb/04/03/05/consumable-reduction.html