United States Historical Budget, 1962 - 2008


These are simply plots of data from:   http://w3.access.gpo.gov/usbudget/fy2004/db.html
This includes projections from the current administration out to 2008.

The calculations are in this OpenOffice 1.1 spreadsheet: outlays.sxc

Historical GDP and 1996-equivalent adjustments for inflation from: http://www.forecasts.org/data/data/GDP96.htm

These plots were basically inspired by some of the graphs near the middle of http://joewalp.stumbleupon.com/ which point to http://www.kowaldesign.com/budget/
Growth of Federal Budget relative to GDP


Interesting things to note:
Looking at http://www.whitehouse.gov/history/presidents/index2.html 
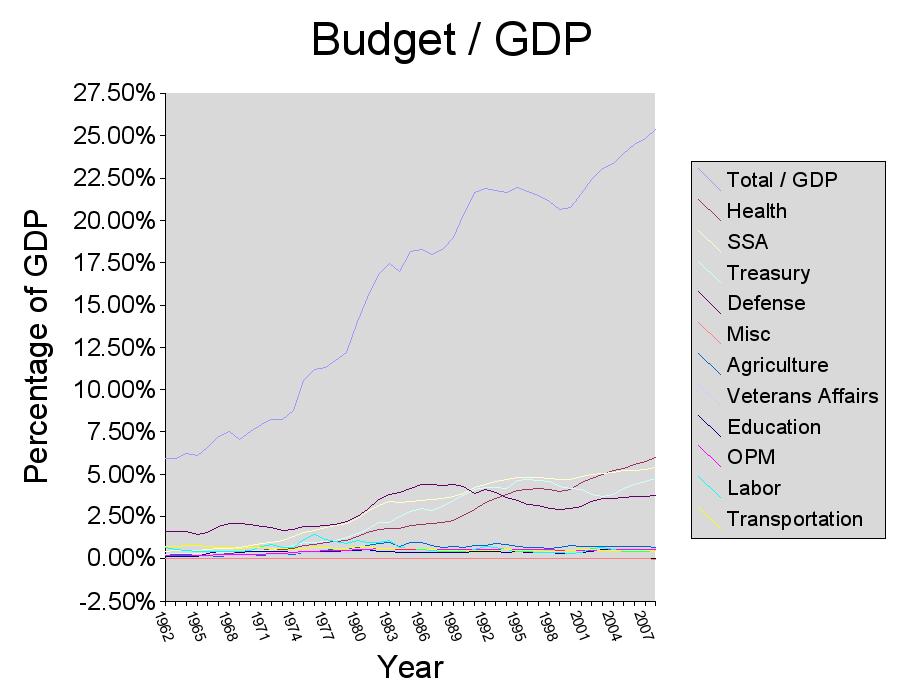
, we see that the larger ramp-ups in the relative size of the federal budget occur at:


Growth of Federal Budget, 1996-equivalent $

The above chart shows the growth of the Federal budget, with values adjusted to 1996 equivalents to account for inflation.  The relative composition from major programs are ordered from smallest to largest in 2004.


Percentages of Federal Budget of Federal Departments